Getting started with K8s HPA & AKS Cluster Autoscaler
Kubernetes comes with this cool feature called the Horizontal Pod Autoscaler (HPA). It allows you to scale your pods automatically depending on demand. On top of that, the Azure Kubernetes Service (AKS) offers automatic cluster scaling that makes managing the size of your cluster a lot easier.
With these two technologies, it is actually fairly easy to make sure that your cluster automatically scales out, and in, to handle the load that your cluster is currently under.
Setting up an AKS cluster
Before we can start playing with AKS cluster scaling, we need an AKS cluster. But with the awesomeness of “the cloud” that is real easy. All we have to do, is to execute a command or two with the Azure CLI and we are good to go.
The first step is to make sure that we have a resource group that we can place our AKS cluster in. So let’s create a new resource group. I’ll call mine AksScalingDemo, and I’ll place it in the North Europe region since I’m in north Europe.
> az group create -n AksScalingDemo -l northeurope
Note: I’m just assuming that you are already logged into the Azure CLI. If not, just run az login…
Once the new resource group is up and running, we can create our cluster by running
> az aks create -g AksScalingDemo -n AksScalingDemo --node-count 1 --kubernetes-version 1.18.8
This will create a 1 node AKS cluster called AksScalingDemo, using Kubernetes version 1.18. The current defaults for this command seems to be a 2 node cluster, which is probably a good idea in most cases, using Kubernetes version 1.17. However, I want a small and cheap cluster, that will require some scaling to handle the load we are about to put on it. And I want to make sure that we use version 1.18 as it includes a feature that we’ll be using later on.
Tip: To list the available K8s versions in your desired region, run az aks get-versions -l <REGION> -o table
Getting the cluster set up will take some time, so let’s go ahead and build an app that we can use to generate some CPU load while that is going on.
Setting up an app to generate some load
To generate some load on the CPU, we need an application that does some calculations. A lot of calculations. Remember, we want it to overload the cluster and force it to scale out. So why not build an application that calculates the available prime numbers up to a certain number.
I’ll start with an empty ASP.NET Core 3.1 application called PrimeCalculator, and add the following code to the UseEndpoints method
app.UseEndpoints(endpoints =>
{
    endpoints.MapGet("/", async context =>
    {
        if (!context.Request.Query.ContainsKey("to") || !int.TryParse(context.Request.Query["to"], out var to))
        {
            to = 10000;
        }
        var primes = Enumerable.Range(2, to)
                        .Where(x =>
                           !Enumerable.Range(3, x / 2)Any(y => x % y == 0)
                        ).ToArray();
        await context.Response.WriteAsync(string.Join(", ", primes));
    });
});
This gives me a basic HTTP endpoint where I can get all prime numbers up to a certain number, either using a fixed value of 10000, or by passing in a query string parameter called to.
With the app created, a simple Dockerfile that packages up my app into a Docker image can be created. It should look something like this
FROM mcr.microsoft.com/dotnet/core/sdk:3.1-buster AS build
WORKDIR /src
COPY ["PrimeCalculator.csproj", "."]
RUN dotnet restore "PrimeCalculator.csproj"
COPY . .
WORKDIR "/src"
RUN dotnet publish "PrimeCalculator.csproj" -c Release -o /app

FROM mcr.microsoft.com/dotnet/core/aspnet:3.1-buster-slim
WORKDIR /app
EXPOSE 80
EXPOSE 443
COPY --from=build /app .
ENTRYPOINT ["dotnet", "PrimeCalculator.dll"]
And then an image can be created by running
> docker build -t zerokoll/primecalculator:0.1 -f ./Dockerfile ./PrimeCalculator
This will create a new image called zerokoll/primecalculator:0.1, that will allow me to push it to a Docker Hub repo.
Note: I have the Dockerfile together with my solution file, one directory above the actual project. This is why I need the -f parameter, and a context that is ./PrimeCalculator
With the image built and ready to rock, it’s time to push it to Docker Hub
> docker push zerokoll/primecalculator:0.1
Ok, now there is a Docker image available that will allow us to generate some load. And hopefully the AKS cluster should be upp and running as well.
Running the prime number calculator in AKS
With the AKS cluster available, it’s time to connect to it. A task that is almost ridiculously easy using the Azure CLI. Just run
> az aks get-credentials -g AksScalingDemo -n AksScalingDemo
This will set up a new kubectl context, with the credentials for the newly created cluster. It will also set it as the default context. So kubectl should be ready to rock.
To create the K8s deployment for the PrimeCalculator application, we need a YAML file.
Note: We don’t really need one, but it is a good practice to use one.
It should look something like this
apiVersion: apps/v1
kind: Deployment
metadata:
  name: scaling-demo
  labels:
    app: prime-calculator
spec:
  replicas: 2
  selector:
    matchLabels:
      app: prime-calculator
  template:
    metadata:
      labels:
        app: prime-calculator
    spec:
      containers:
      - name: prime-calculator
        image: zerokoll/primecalculator:0.1
        ports:
        - containerPort: 80
        resources:
          requests:
            memory: "64Mi"
            cpu: "250m"
          limits:
            memory: "128Mi"
            cpu: "500m"
---
apiVersion: v1
kind: Service
metadata:
  name: prime-calculator
spec:
  selector:
    app: prime-calculator
  type: LoadBalancer
  ports:
    - protocol: TCP
      port: 80
This will create a deployment with 2 replicas running the zerokoll/primecalculator image. Each replica will request 64Mb memory and a quarter of a CPU. And they will be limited to 128Mb memory and about half a CPU.
It also creates a LoadBalancer service that will give us a public IP address that we can use to reach the application.
With the YAML in place, it can be added to the cluster by running
> kubectl apply -f ./deployment.yml
To figure out what IP-address the LoadBalancer service got, we can run
> kubectl get svc

NAME               TYPE           CLUSTER-IP    EXTERNAL-IP   PORT(S)        AGE
kubernetes         ClusterIP      10.0.0.1      <none>        443/TCP        102m
prime-calculator   LoadBalancer   10.0.160.47   20.54.88.78   80:30609/TCP   33s
And as you can see, in my case, I got 20.54.88.78. This allows me to open my browser and browse to http://20.54.88.78.
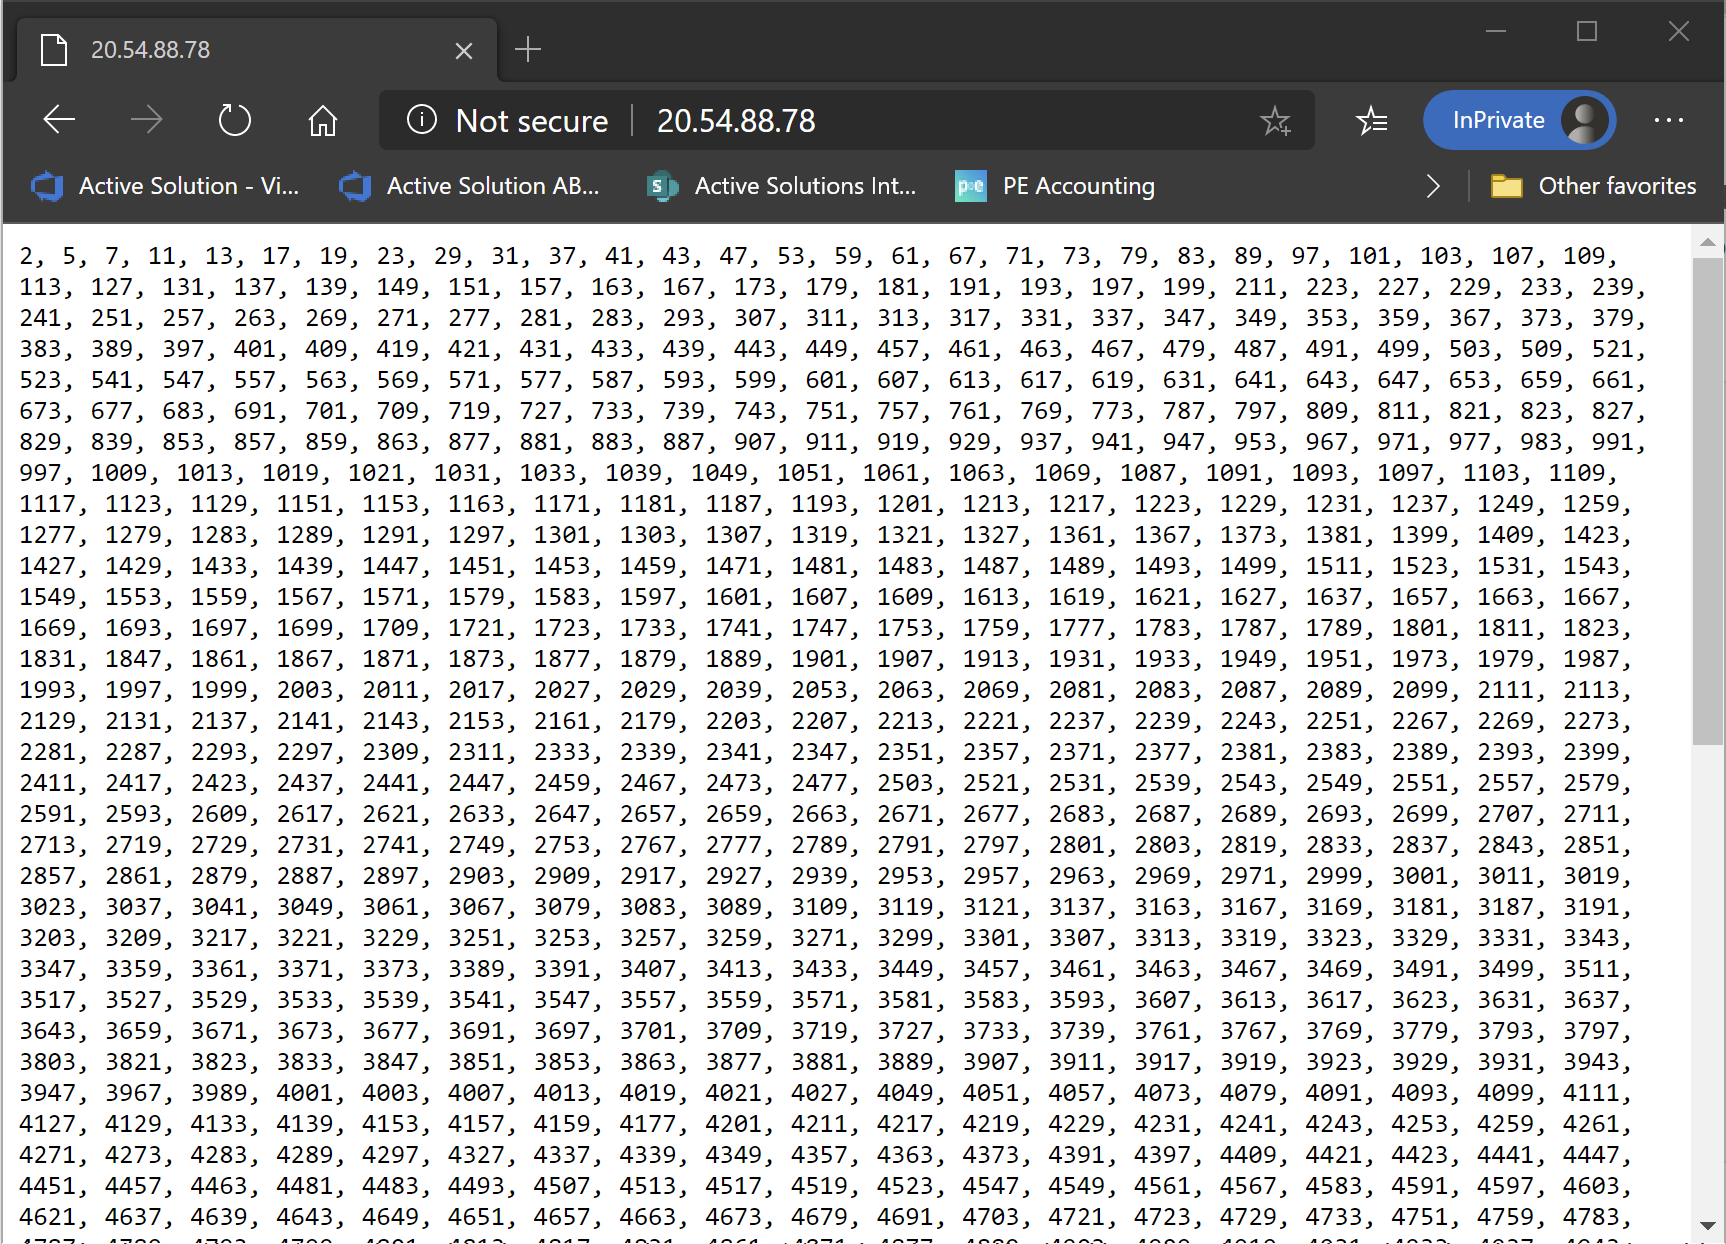
Ok, now that we have the application up and running, I guess it is time to focus on adding some load, and the scaling part of the post.
Monitoring load
The easiest way to monitor the load in our cluster is to use the Kubernetes Dashboard. This is built into AKS, and is really easy to use. However, it needs to be enabled first. Like this
> az aks enable-addons --addons kube-dashboard -g AksScalingDemo -n AksScalingDemo
Note: This seems to be a new requirement in 1.18. In previous versions, it was enabled by default.
Once the dashboard is enabled, we can start using it. However, it isn’t publicly available, so we need to proxy calls to it. Luckily, that is a simple task using the Azure CLI. Just run
> az aks browse -g AksScalingDemo -n AksScalingDemo
This will set up a proxy to the Dashboard, and leave it open for as long as the command is executing. It will also be nice enough to open a browser window pointing at the somewhat long URL needed to reach the Dashboard.
Once you get to this point, you will be faced with the following screen
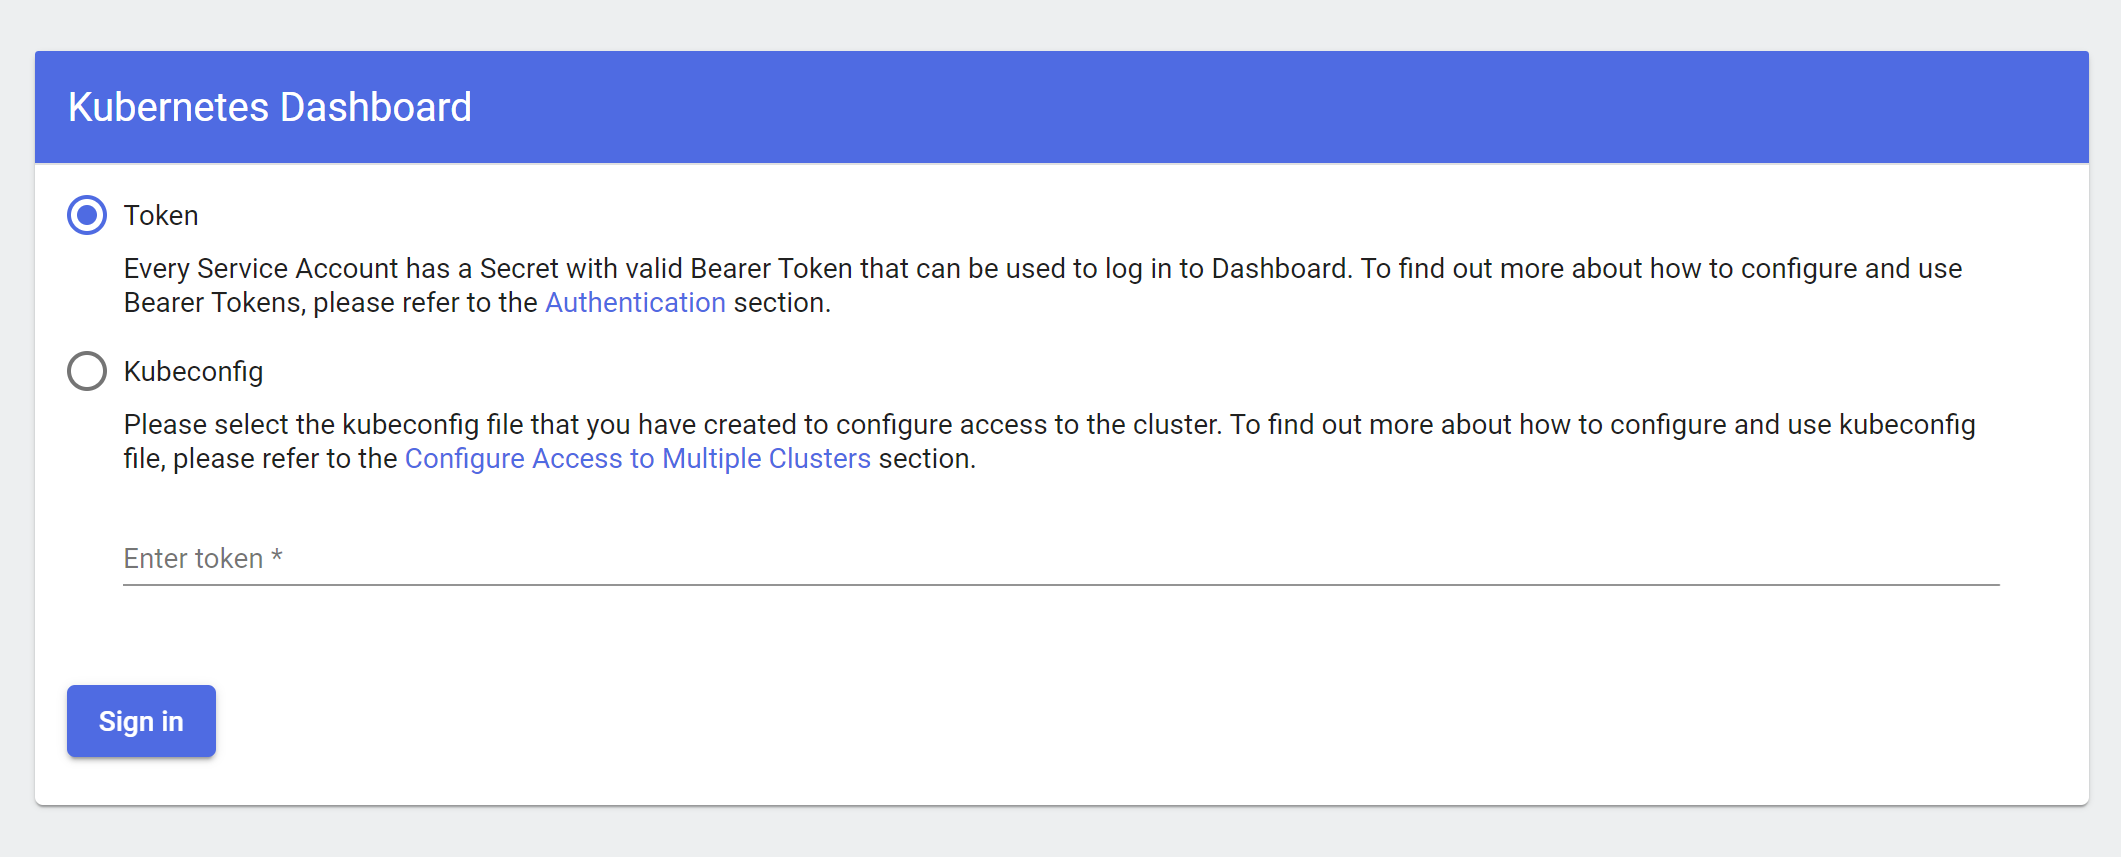
This let’s you know that you obviously need to log in. Something that can be done in 2 ways, using a access token, or using a Kubeconfig. I find it easiest to use a token as I have several contexts in my Kubeconfig.
“What access token?” do you ask. Well, we can use the one from our kubectl configuration. Just run
kubectl config view

clusters:
- cluster:
    certificate-authority-data: DATA+OMITTED
    server: https://aksscaling-aksscalingdemo-ba40d9-aaf92fb9.hcp.northeurope.azmk8s.io:443
  name: AksScalingDemo
- cluster:
    certificate-authority-data: DATA+OMITTED
    server: https://kubernetes.docker.internal:6443
  name: docker-desktop
contexts:
- context:
    cluster: AksScalingDemo
    user: clusterUser_AksScalingDemo_AksScalingDemo
  name: AksScalingDemo
- context:
    cluster: docker-desktop
    user: docker-desktop
  name: docker-desktop
- context:
    cluster: docker-desktop
    user: docker-desktop
  name: docker-for-desktop
current-context: AksScalingDemo
kind: Config
preferences: {}
users:
- name: clusterUser_AksScalingDemo_AksScalingDemo
  user:
    client-certificate-data: REDACTED
    client-key-data: REDACTED
    token: XXX
- name: docker-desktop
  user:
    client-certificate-data: REDACTED
    client-key-data: REDACTED
And copy the users.user.token value for the user you want to use. In my case, it’s the user with the name clusterUser_AksScalingDemo_AksScalingDemo.
Note: As you have a proxy call open already, you will either need to temporarily close it down to run this command, or open another terminal…
Once we log in, we are potentially faced with the following
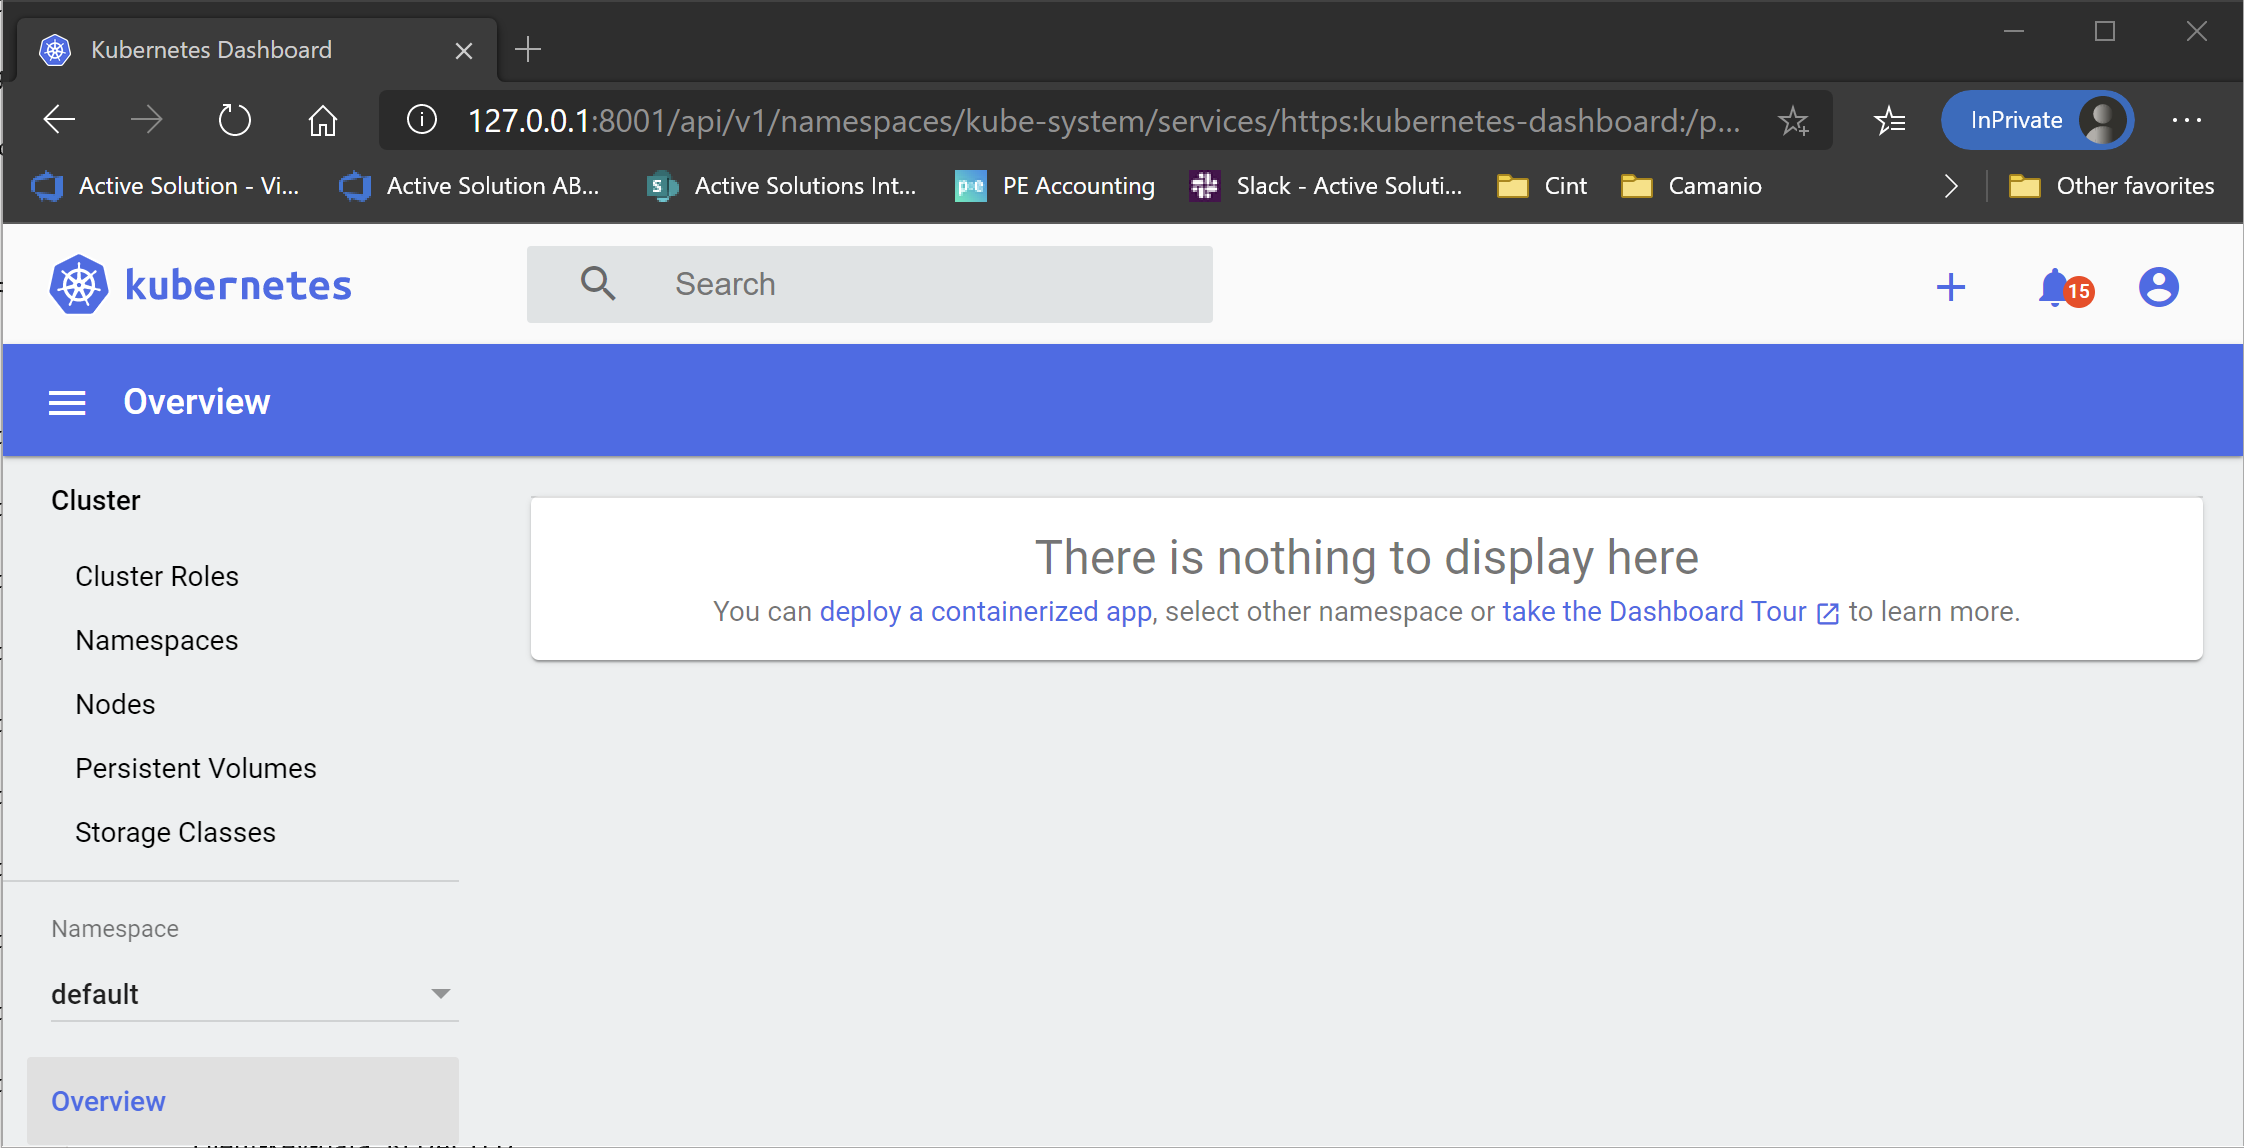
However, it doesn’t actually mean that there is nothing running in the cluster. You just aren’t allowed to view it because of some permissions happen to be a bit messed up.
Hopefully, you aren’t seeing this, but at the time of writing, you need(ed) to run a couple of commands to reset the permissions. They look like this
kubectl delete clusterrolebinding kubernetes-dashboard
kubectl create clusterrolebinding kubernetes-dashboard --clusterrole=cluster-admin --serviceaccount=kube-system:kubernetes-dashboard --user=clusterUser
That re-assigns the required permissions, and the Dashboard should start showing you some information about the cluster right away
Note: If you want to know more about this error, there is a GitHub issue for it here: https://github.com/Azure/AKS/issues/1573
Ok, let’s go ahead and have a look at the current load situation. This can be found by clicking on Workloads > Pods in the menu on the left
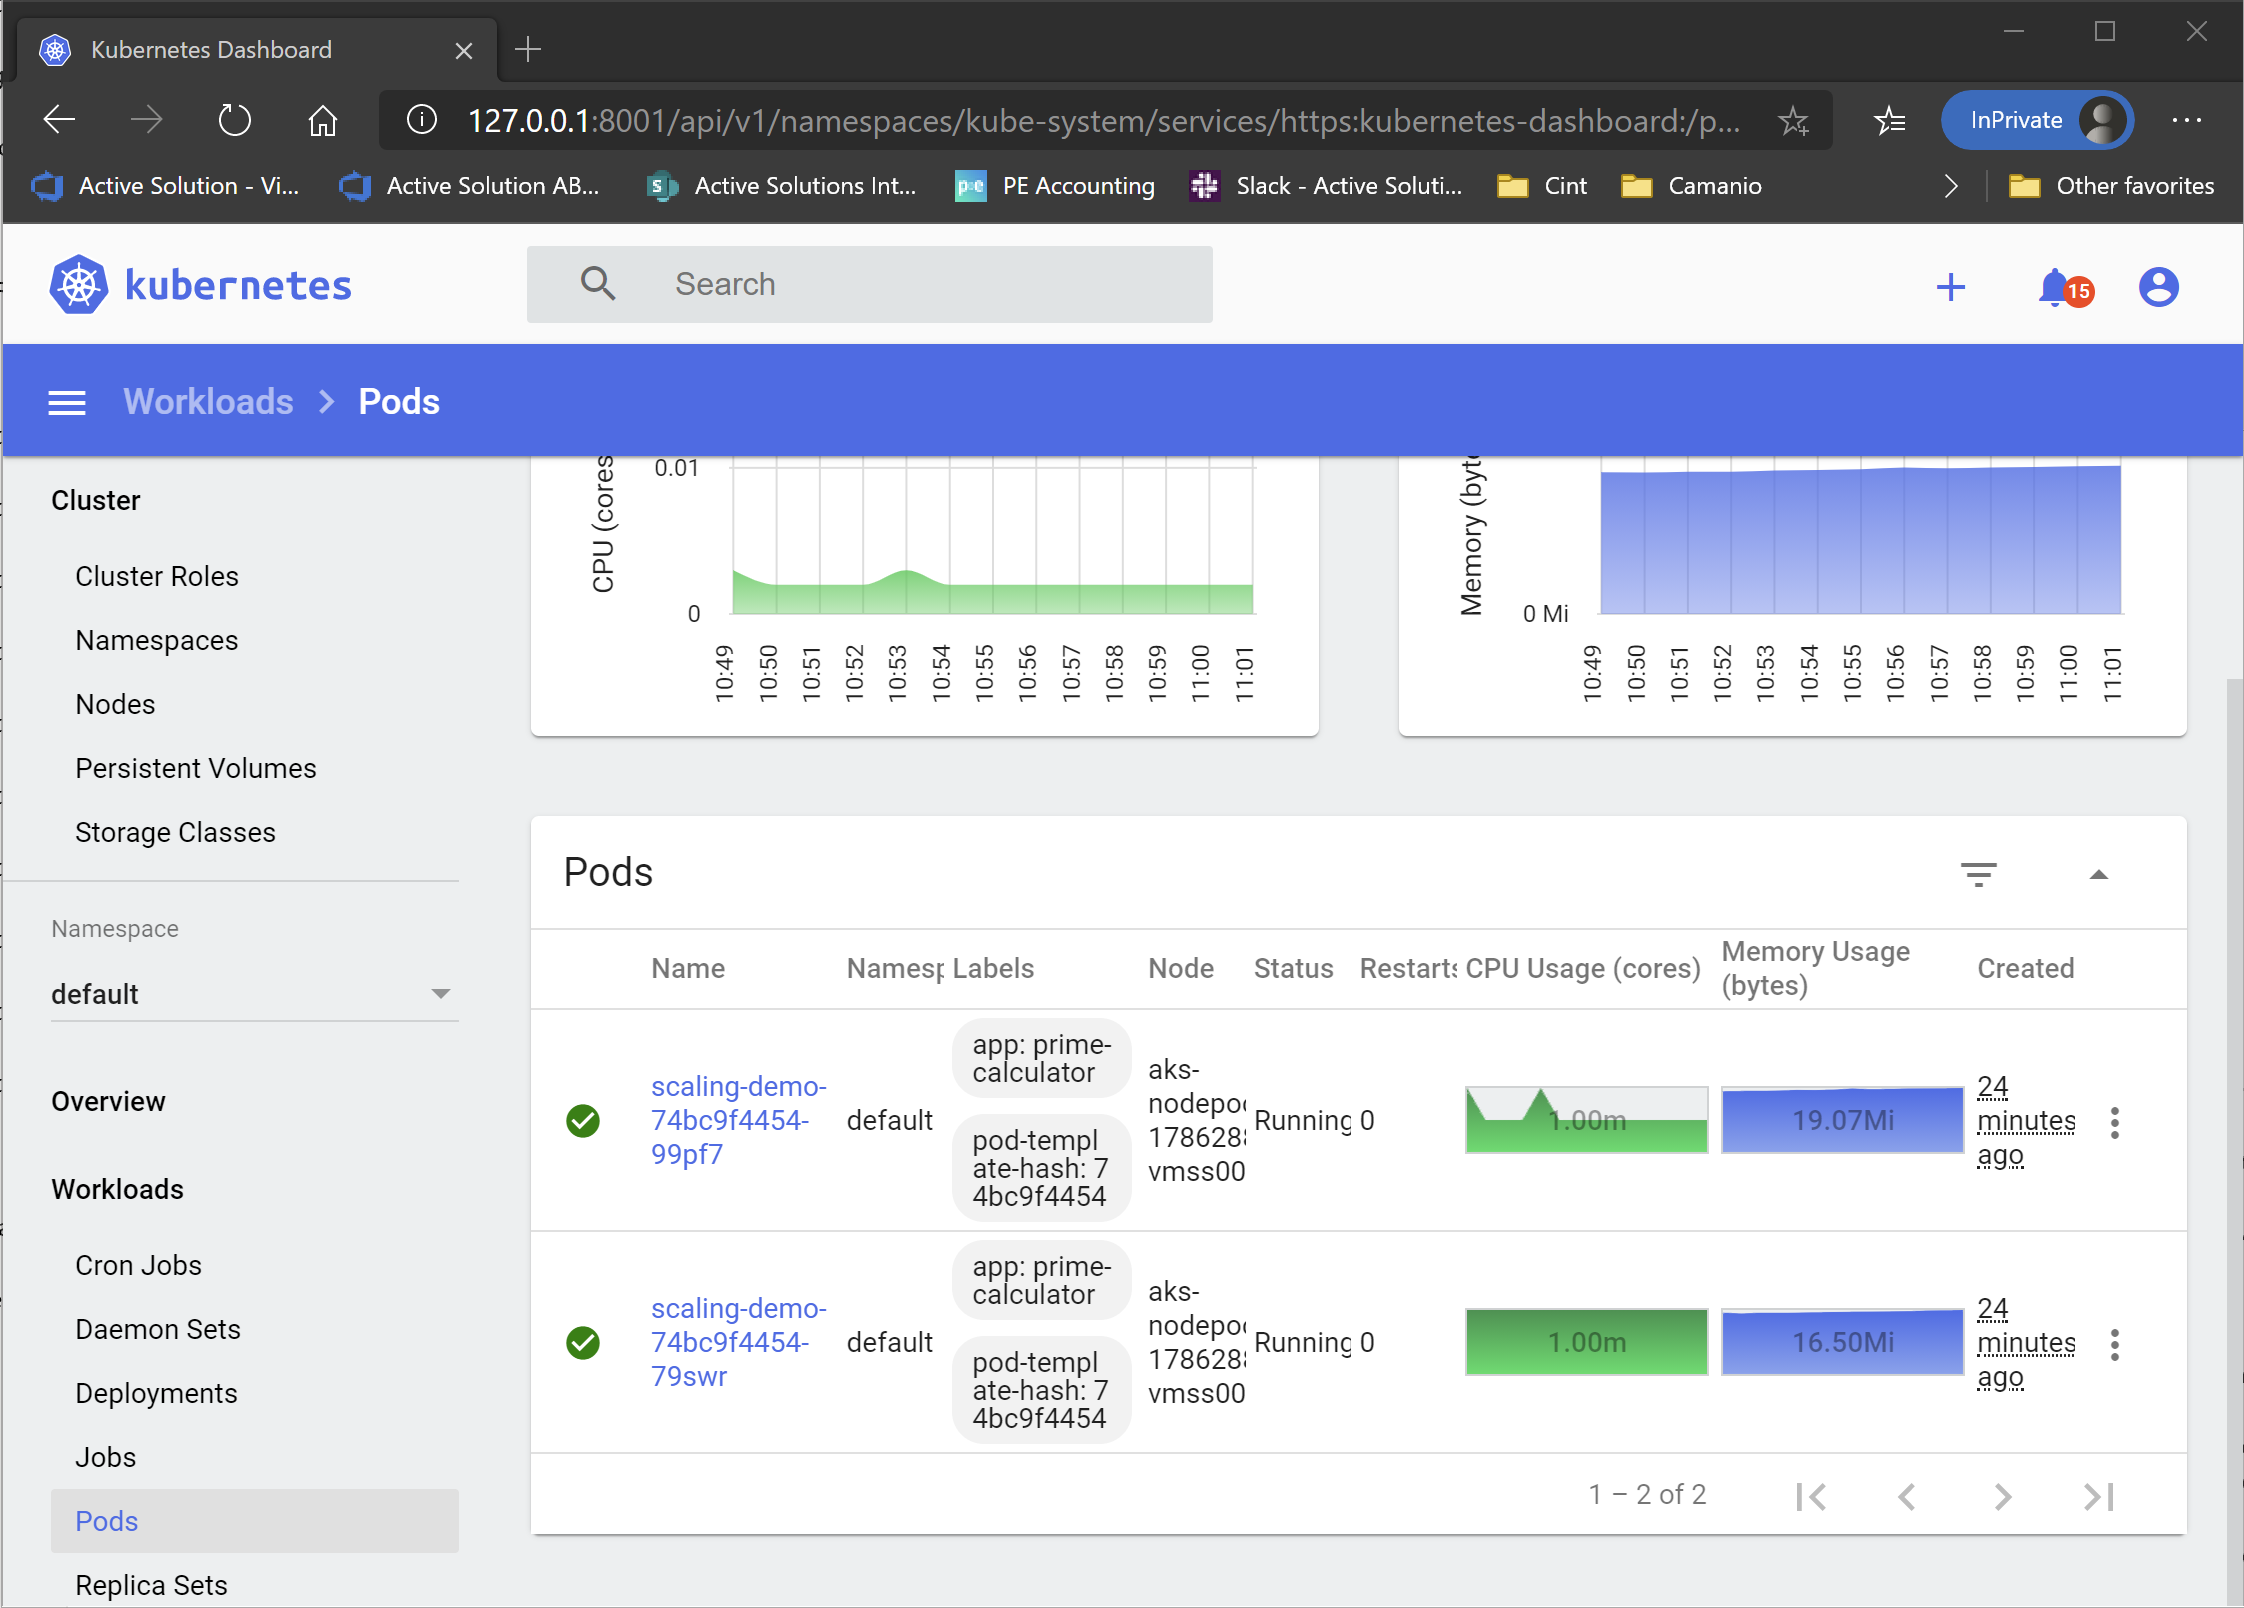
As you can see, there is not a lot going on right now. The CPU load is almost nothing, and the memory load is 16.5/19 Mb. Which I guess is to be expected in a system that doesn’t actually do anything. So let’s add some load to the system
Generating some load
Now that we have an endpoint that we can request to generate some load, we need to request it a lot. Enough to bring the system onto its knees, and force it to scale out.
You can use any load testing tool for this, but I chose https://github.com/codesenberg/bombardier. It is a simple tool to use, making it very to do some simple load testing.
With Bombardier downloaded, I run the following command to create some load
> .\bombardier.exe --duration=30s --rate=20 --timeout=20s http://20.54.88.78
This will run a load test for 30 seconds, making requests to 20.54.88.78 about 20 times per second. I also made sure to increase the connection timeout from the default 2 seconds to 20 seconds in case the responses started slowing down.
Note: 20.54.88.78 is the IP address for my LoadBalancer service as mentioned above. You obviously need to replace it with your own
This load test results in
Bombarding http://20.54.88.78:80 for 30s using 125 connection(s)
[===========================================================================================================================] 30s
Done!
Statistics        Avg      Stdev        Max
  Reqs/sec        22.05      99.54    1268.27
  Latency         5.04s      1.40s      9.89s
  HTTP codes:
    1xx - 0, 2xx - 781, 3xx - 0, 4xx - 0, 5xx - 0
    others - 0
  Throughput:   163.04KB/s
As we can see, the system handles the load, returning HTTP 200 responses. However, it does obviously increase the load on the nodes
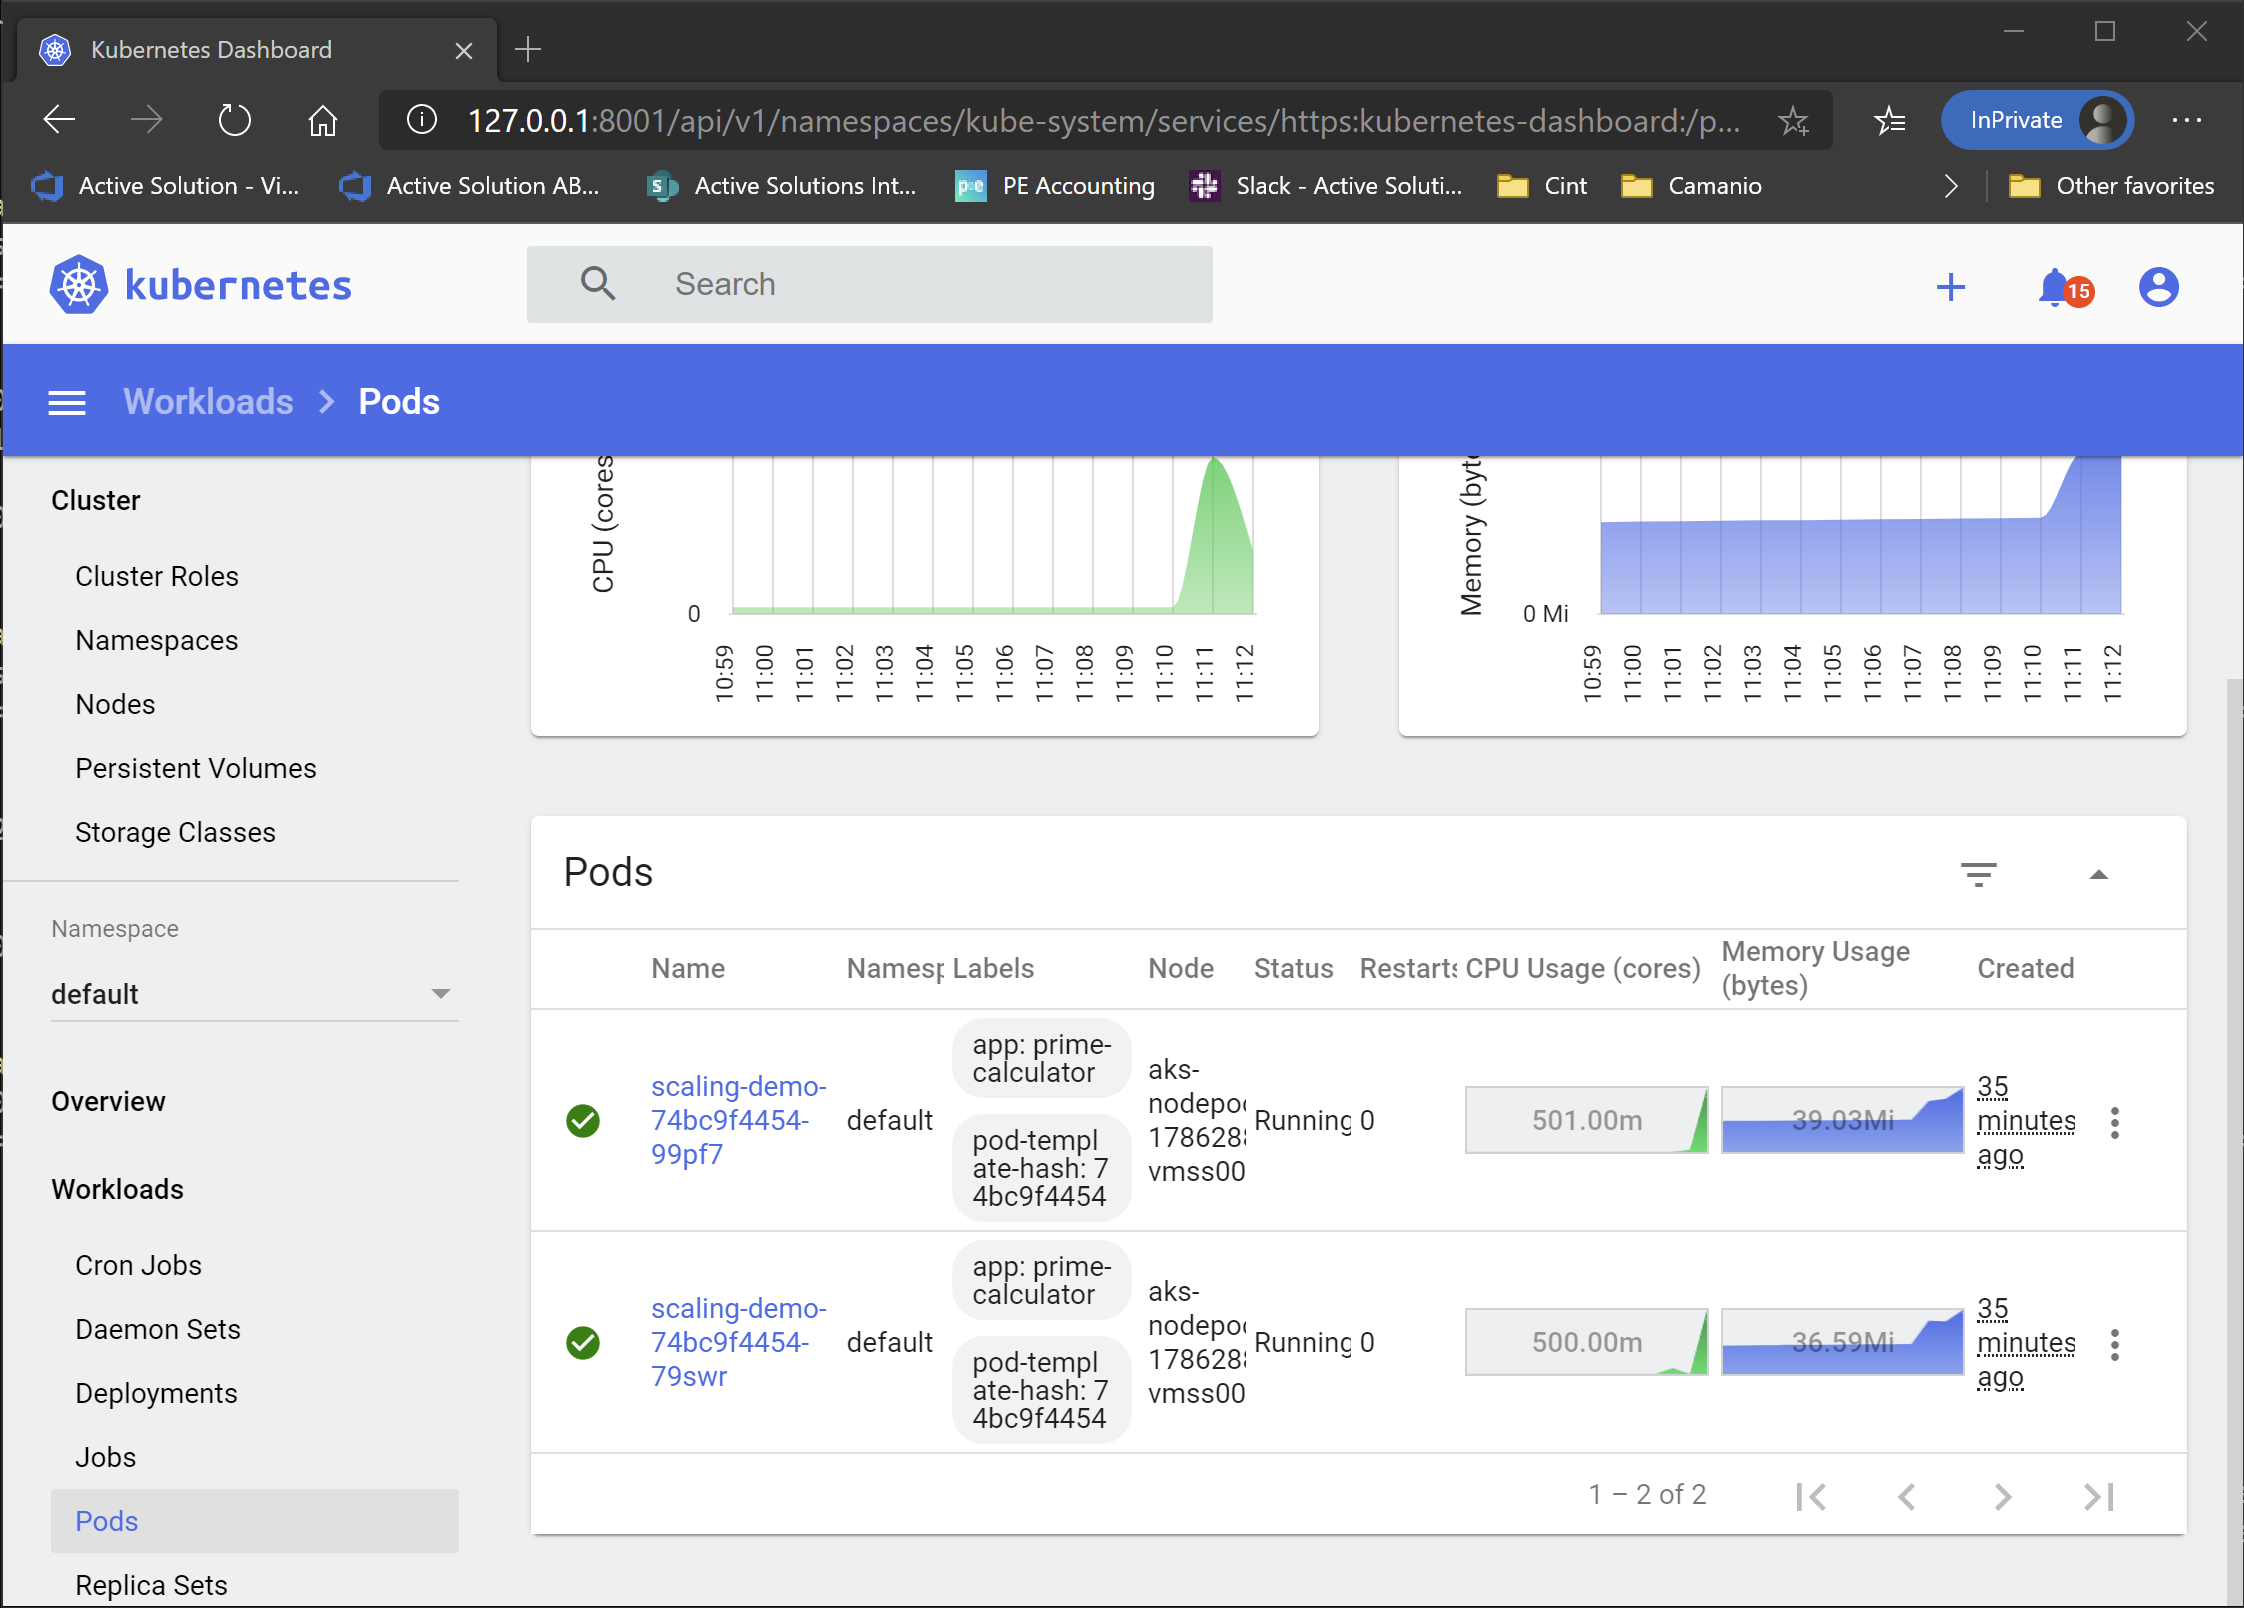
As you can see, the pods are now maxing out at half a CPU, which is the limit I set in the deployment. So they are probably not coping with the load properly as well as they should.
Note: The Dashboard uses the metrics server in the K8s system to get the data needed. However, there is a somewhat significant lag in there. And by significant, I mean 30 secs or so, which isn’t a problem in a real system, but kind of annoying when doing demos like this… But as long as you are patient, you should see the load increase. If not, try to let Bombardier run for a bit longer!
Ok, so how do we cope with the load being to high?
Using the Kubernetes Horizontal Pod Autoscaler (HPA)
The first step is to use the HPA, and have it scale out the number of replicas when the load is too high.
Note: Another solution would be to increase the resource limits (depending on the node size), but that isn’t what this post is about… ;)
To create an HPA, we need another YAML file. It should look something like this
apiVersion: autoscaling/v2beta2
kind: HorizontalPodAutoscaler
metadata:
  name: scaling-demo-hpa
spec:
  maxReplicas: 10
  minReplicas: 1
  scaleTargetRef:
    apiVersion: apps/v1
    kind: Deployment
    name: scaling-demo
  metrics:
    - type: Resource
      resource:
        name: cpu
        target:
          type: Utilization
          averageUtilization: 60
This will set up an HPA called scaling-demo-hpa. It will scale the deployment called scaling-demo between 1 and 10 replicas based on a CPU metric that says that it shouldn’t use more than average of 60% CPU.
There are a ton more metrics that you can use to scale your system, including custom metrics. You can read more about the details at https://kubernetes.io/docs/tasks/run-application/horizontal-pod-autoscale/.
A little caveat here, is the need to use a Kubernetes version that supports API version autoscaling/v2beta2. You can verify that your cluster supports this by running
> kubectl api-versions
This will give you a list of supported API versions for your cluster.
However, if you are running a cluster with a K8s version less than 1.18, it will say that the API is available. But it will unfortunately not support the metrics feature, and all the power it brings along with it. Instead, you are limited to a setting called targetCPUUtilizationPercentage, which, as the name suggests, limits you to scale based on CPU utilization. So for this demo, that will work just as well. But in a more complex, production scenario, the metrics feature could really useful as it is way more powerful.
Once we have applied the HPA using the following command
> kubectl apply -f ./hpa.yml
The HPA will have been added to the cluster, and we can start adding some load on it again. But this time, I’m going to let it run for a bit longer to make sure that the HPA has time to scale up the pod count. So I’ll run
> .\bombardier.exe --duration=5m --rate=100 --timeout=20s http://20.54.88.78/
After a while, you should see the load on the pods increase in the Dashboard. And fairly soon after that, you should see new pods popping up as the HPA tries to keep the pod CPU utilization below 60%.
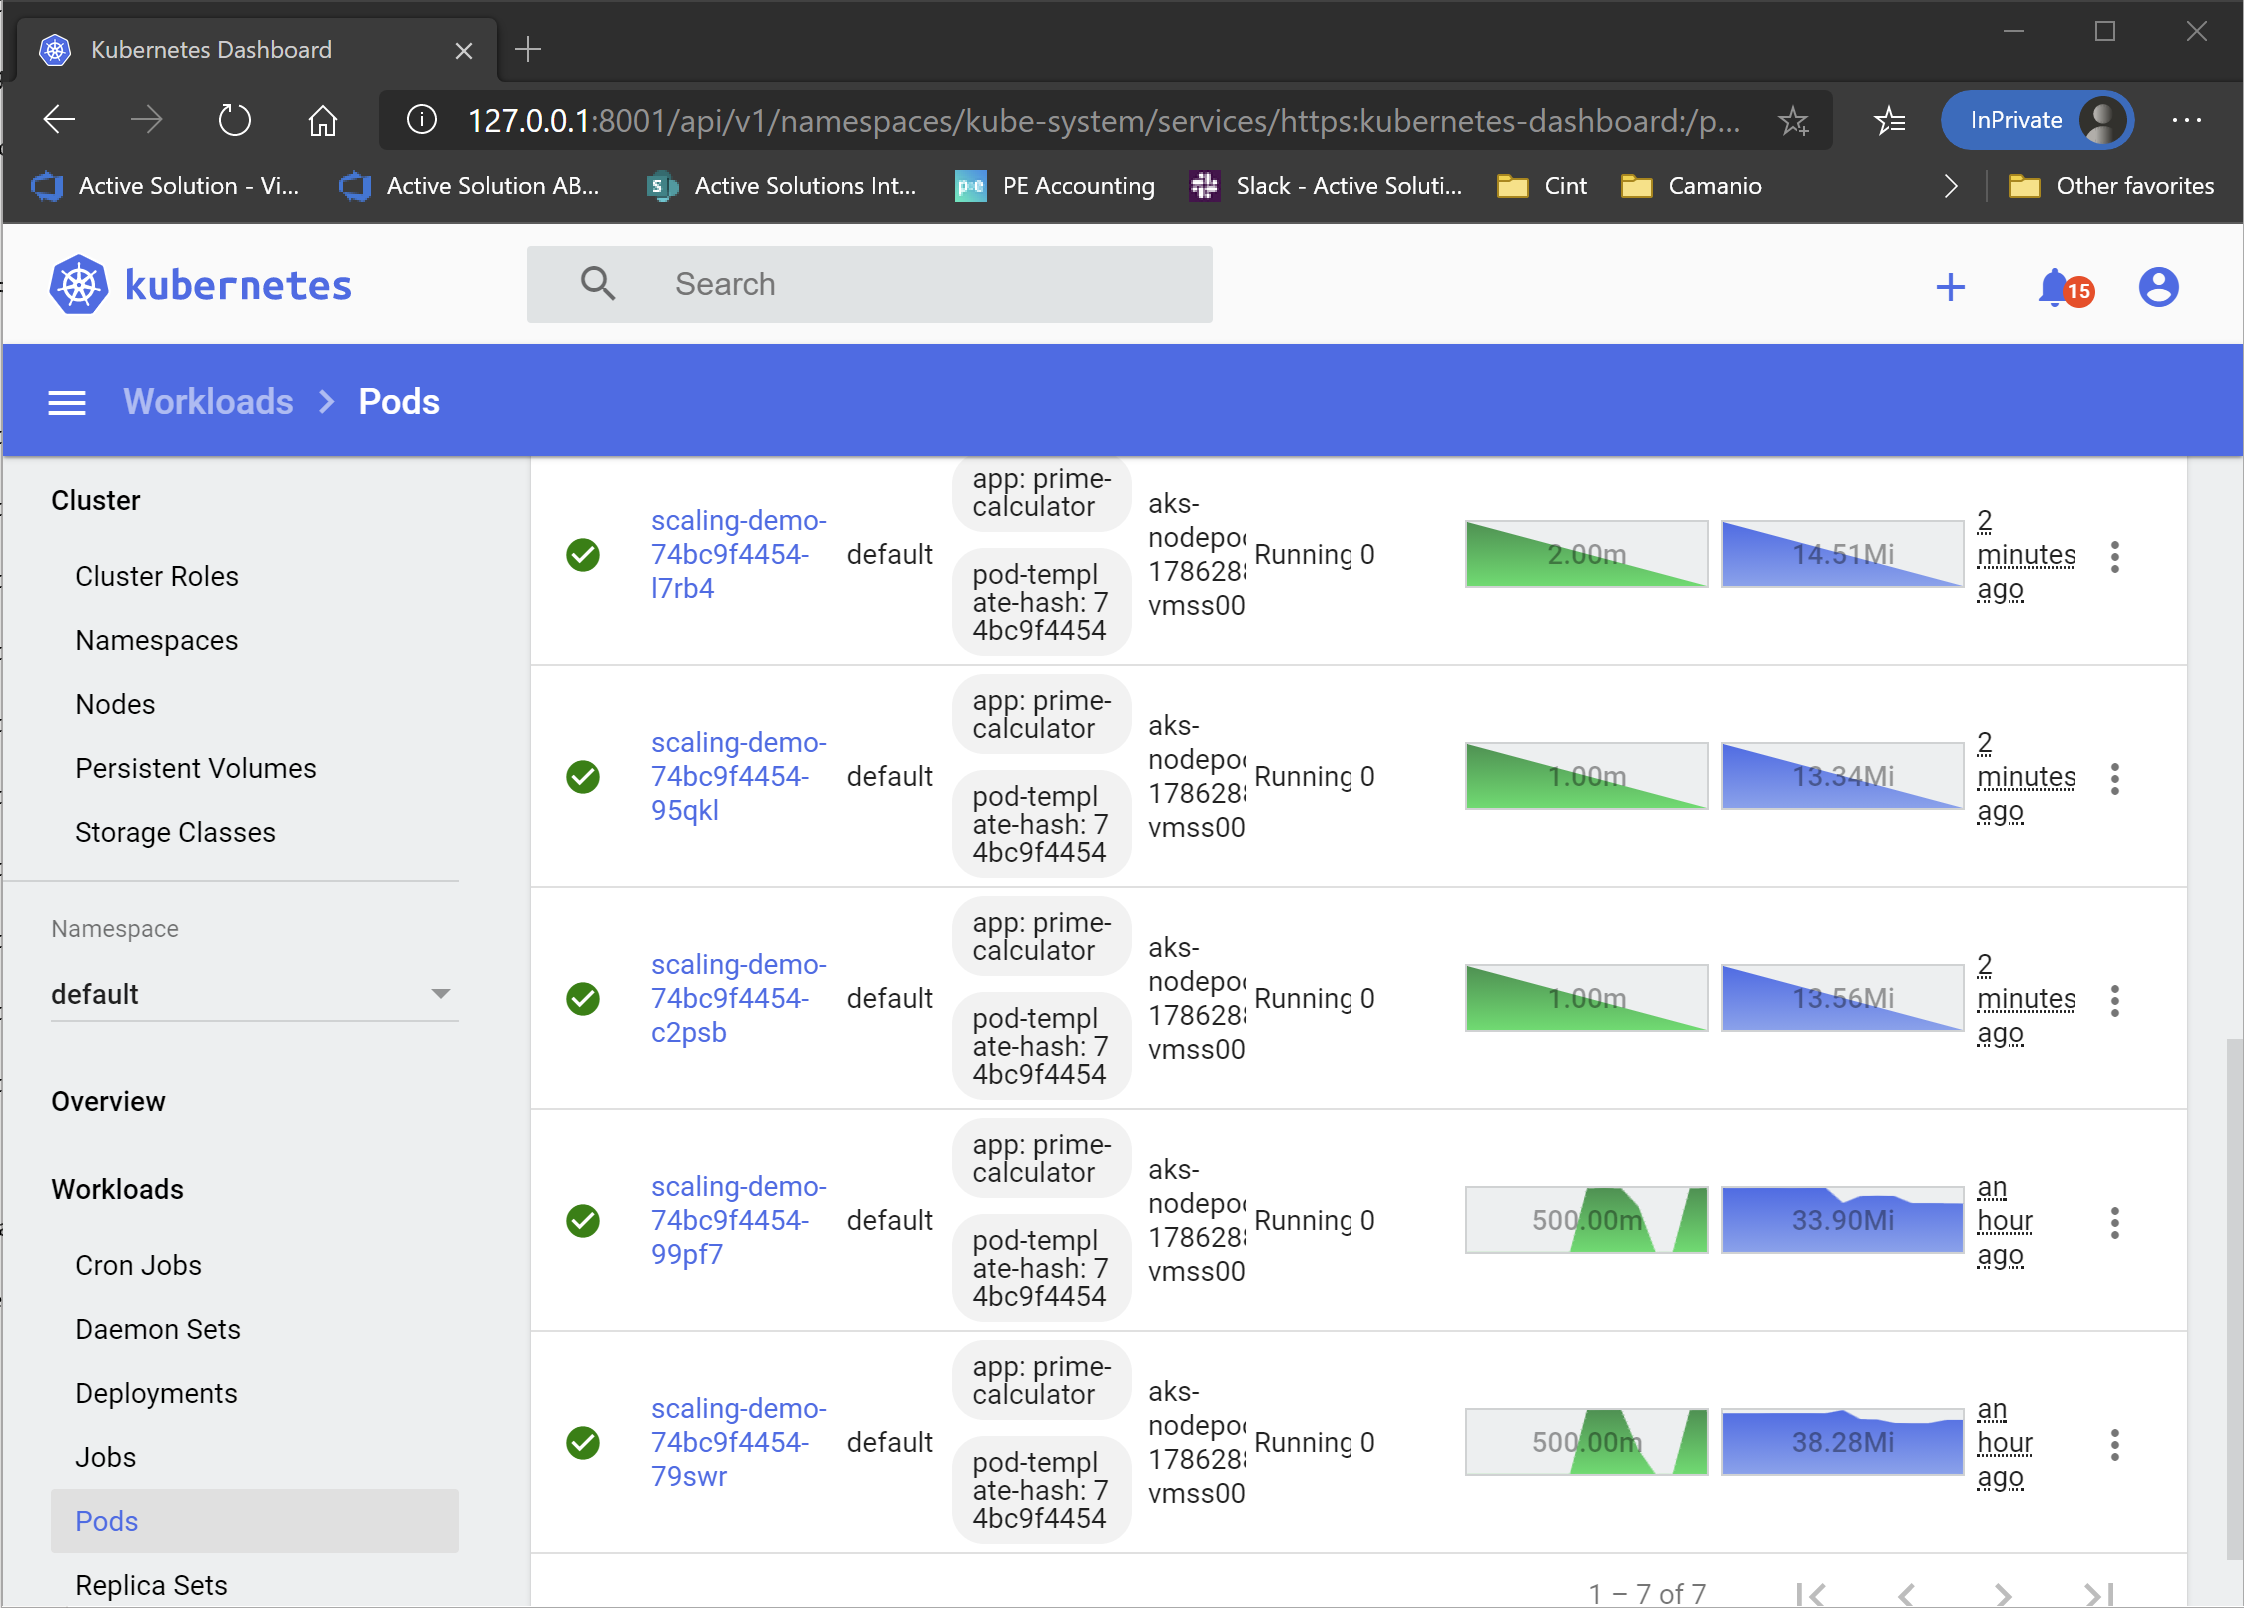
If you are curious as to WHY the HPA has scaled up you replica count, you can run
> kubectl describe hpa scaling-demo-hpa

Name:                                                  scaling-demo-hpa
Namespace:                                             default
Labels:                                                <none>
Annotations:                                           kubectl.kubernetes.io/last-applied-configuration:
                                                         {"apiVersion":"autoscaling/v2beta2","kind":"HorizontalPodAutoscaler","metadata":{"annotations":{},"name":"scaling-demo-hpa","namespace":"d...
CreationTimestamp:                                     Fri, 02 Oct 2020 11:38:48 +0200
Reference:                                             Deployment/scaling-demo
Metrics:                                               ( current / target )
  resource cpu on pods  (as a percentage of request):  199% (499m) / 60%
Min replicas:                                          1
Max replicas:                                          10
Deployment pods:                                       2 current / 4 desired
Conditions:
  Type            Status  Reason            Message
  ----            ------  ------            -------
  AbleToScale     True    SucceededRescale  the HPA controller was able to update the target scale to 4
  ScalingActive   True    ValidMetricFound  the HPA was able to successfully calculate a replica count from cpu resource utilization (percentage of request)
  ScalingLimited  True    ScaleUpLimit      the desired replica count is increasing faster than the maximum scale rate
Events:
  Type    Reason             Age   From                       Message
  ----    ------             ----  ----                       -------
  Normal  SuccessfulRescale  21s   horizontal-pod-autoscaler  New size: 4; reason: cpu resource utilization (percentage of request) above target
In the Events section, you can see what the HPA is doing, as well as why. You can also see the metrics being collected and used, as well as the current and desired number of pods.
However, after running the current load for a while, you will start seeing pods that can’t be scheduled.
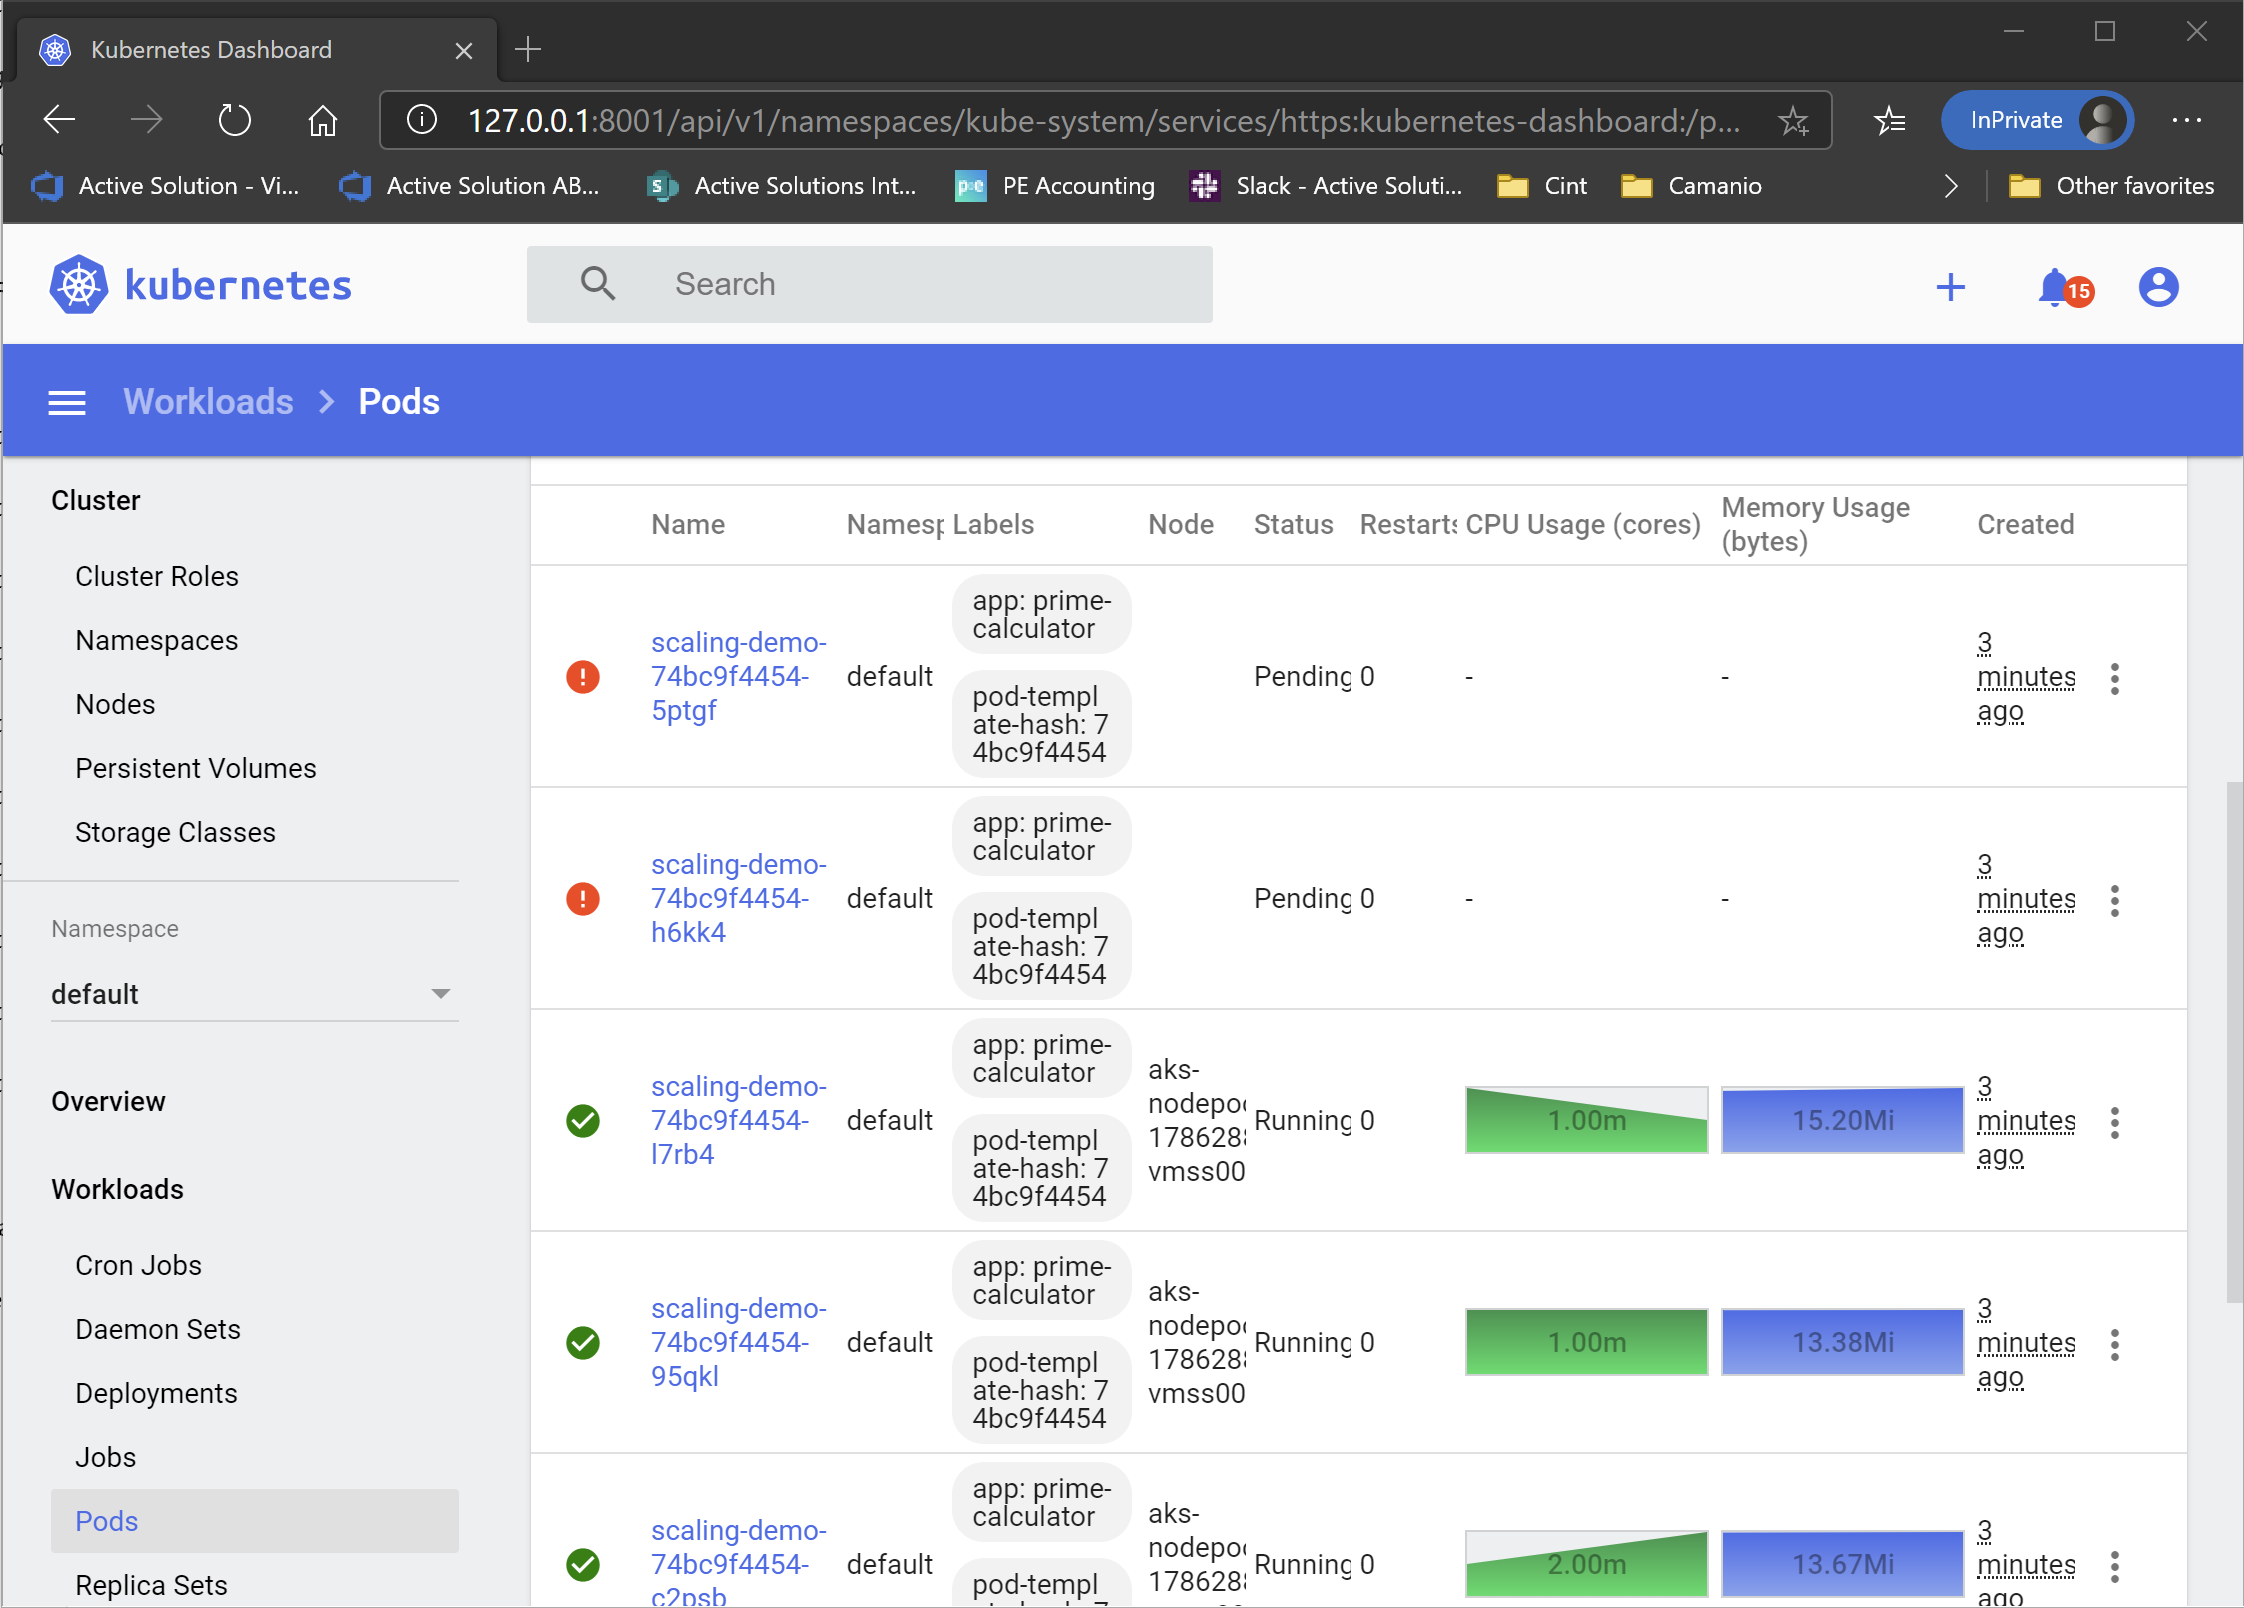
The reason for this is that the cluster is running out of resources. The nodes are being overloaded, and there is not enough CPU available to satisfy the pod’s requests.
Enabling the AKS Auto Scaler
To solve this problem, we need more nodes and more resources. Something that can be solved by going in and scaling up the node count, using the Azure CLI or the Portal for example. It could even be automated using tools in Azure. But the easiest way is to enable the AKS cluster autoscaler. All you need to do, is to run the following command
> az aks update --resource-group AksScalingDemo --name AksScalingDemo --enable-cluster-autoscaler --min-count 1 --max-count 3
This will enable the autoscaler in our AKS cluster, setting the upper limit to 3 nodes, and the lower to 1.
Note: The autoscaler can be turned on at creation as well by providing –enable-cluster-autoscaler, –min-count and –max-count flags instead of –node-count
This will take a minute or so to run, but as soon as it is done, you can look at the Cluster > Nodes part of the Dashboard, and you will see that a node is being added to the cluster to handle the need for more resources. And as soon as the new node is on-line, the unscheduled pods are scheduled, and the system is happy.
The autoscaler works by looking at pods that aren’t able to be scheduled due to resource limitations, and scales up the node count when this happens. And when pods are removed, and the load decreases below a set point, the extra, under utilized nodes are removed, and the existing pods are divided among the remaining nodes.
Scaling down
Scaling down takes a little while. The reason for this is that you don’t want the cluster scaling up and down immediately whenever the load changes. This is called “flapping”, and would cause a potentially somewhat unstable system. Because of this, the HPA will wait for 5 minutes of decreased load before it decreases the number of pods. This is called a stabilization window.
As of Kubernetes version 1.18, this window, together with a bunch of other things, can be configured using something called behaviors and scaling policies. This is a fairly advanced topic, but I want show it very briefly, by lowering the stabilization window to one minute, to make sure my pods are scaled down a bit faster for this demo.
To change the stabilization window for scaling down, we add a scale down policy to our HPA like this
apiVersion: autoscaling/v2beta2
kind: HorizontalPodAutoscaler
metadata:
  name: scaling-demo-hpa
spec:
  …
  behavior:
    scaleDown:
      stabilizationWindowSeconds: 60
After applying this to the cluster, the HPA will now start scaling down only 60 seconds after the metrics in question are considered low enough, instead of the default 300.
The AKS autoscaler also has some configuration that can be modified through something called an cluster autoscaler profile. This profile allows you to configure a bunch of things, including setting the stabilization window for scaling out and in. By default, the profile is configured with reasonable values that make sure that the cluster isn’t adding and removing nodes unnecessarily. But if you have scenarios where you need to change this, it can be done using this profile.
Note: At the time of writing, this is a preview feature, and because of this, not part of the Azure CLI. So, if you want to play with this feature, you need to enable the AKS preview features by running az extension add --name aks-preview or az extension update --name aks-preview, depending on if you already have an old preview installed.
With the extension installed (or if it has been enabled in the CLI by default by now), you can do things like
> az aks update -g AksScalingDemo -n AksScalingDemo --cluster-autoscaler-profile scale-down-unneeded-time=5m
This sets the scale down window to 5 minutes, instead of the default 10.
More information about the auto scaler profile can be found here: https://docs.microsoft.com/en-us/azure/aks/cluster-autoscaler#using-the-autoscaler-profile
Cleaning up
The last part is to make sure that we clean up our resources so they don’t cost us a bunch of money when we don’t need them.
I’ll go ahead and delete my cluster together with the whole resource group by running
> az group delete -n AksScalingDemo
Another option, if you want to play with your cluster again at a later point, is to stop it. This is a new feature, that is (once again, at the time of writing) in preview. This will backup the current state of the etcd store before stopping and removing all of the nodes in the cluster. It will also turn off the AKS control plane to save even more money.
However, it then allows you to start everything back up again, and have Kubernetes use the backed up etcd data to restore the cluster to it’s previous state. This can save you quite a bit of money if you are only using the cluster once in a while. Or maybe only use it during office hours. While still making sure that you don’t have to spin up a new cluster from scratch.
More information about the start/stop feature can be found at https://docs.microsoft.com/en-us/azure/aks/start-stop-cluster.
Conclusion
Well, that was it for this time. As you can see, enabling horizontal scaling of both pods inside the cluster, and the cluster itself, isn’t actually that hard when running in AKS. The HPA is available for any Kubernetes cluster, as long as it has been upgraded to a recent release. The AKS autoscaler on the other hand, is obviously a part of Azure and AKS, and will only work there.
But with this knowledge, there is really no reason for you to not make sure that you have automated horizontal scaling built into your solution. Even if it might not be used a whole lot, it is still better to have it and not need it, than to need it a not have it, as they say.
Hope you got something useful out of this post, and if you have any questions or comments, I’m available on Twitter at @ZeroKoll as always!